Mar 12, 2025
Logging and metrics services and Aiven: an overview
Ever wanted to know the breadth of logging and metrics tooling available with easy integration to the Aiven platform and on the platform itself? Look no further!

Celeste Horgan
|RSS FeedDeveloper Educator at Aiven
Logging and metrics data, regardless of what your business does digitally, are some of the most prolific data types that any service or application can produce. Logging data is generally about specific events that you care about in your application and metrics data is generally about overall system performance and uptime. The main difference between these types of data is that metrics are usually numerical in nature and are generated at regular intervals, whereas logs typically have some amount of text attached to them and occur at irregular intervals.
The biggest challenge any business faces is knowing when to store and when to analyze, and how those choices affect latency, accuracy and usefulness of your data. In this article, we’ll go through two common techniques and when they make sense to use for you, and what Aiven services and Aiven integrations you can use to help!
Architecture concerns: when to store and when to analyze
There are two interrelated challenges to consider when working with logging and metrics data: the first is storage, and the second is analysis of that data.
Store first, then analyze
This is the path that most businesses take for their data. Because both metrics and logs produce high volumes of data, usually a business decides on a relevant timeframe of ‘hot’ data to store in an easily accessible datastore like a database, and then relegates the rest of the data to cheaper ‘cold’ storage like an Amazon S3 bucket. ‘Hot’ data is most likely to be accessed by users using analytics or monitoring software to begin with, and relevant windows of ‘cold’ data can be retrieved, loaded from cold storage into a database, and displayed for the user if desired, though there will be lag due to the retrieval process.
This is the method preferred by most businesses, because it ensures reliability for all logging and metric data, and provides fast-enough retrieval most of the time, as users are typically analyzing events that happened in the recent past. From a setup perspective, however, it requires more systems in place and is more costly to maintain.
If the application generating metrics and logs is, say, a web frontend, a sample architecture might look like the following:
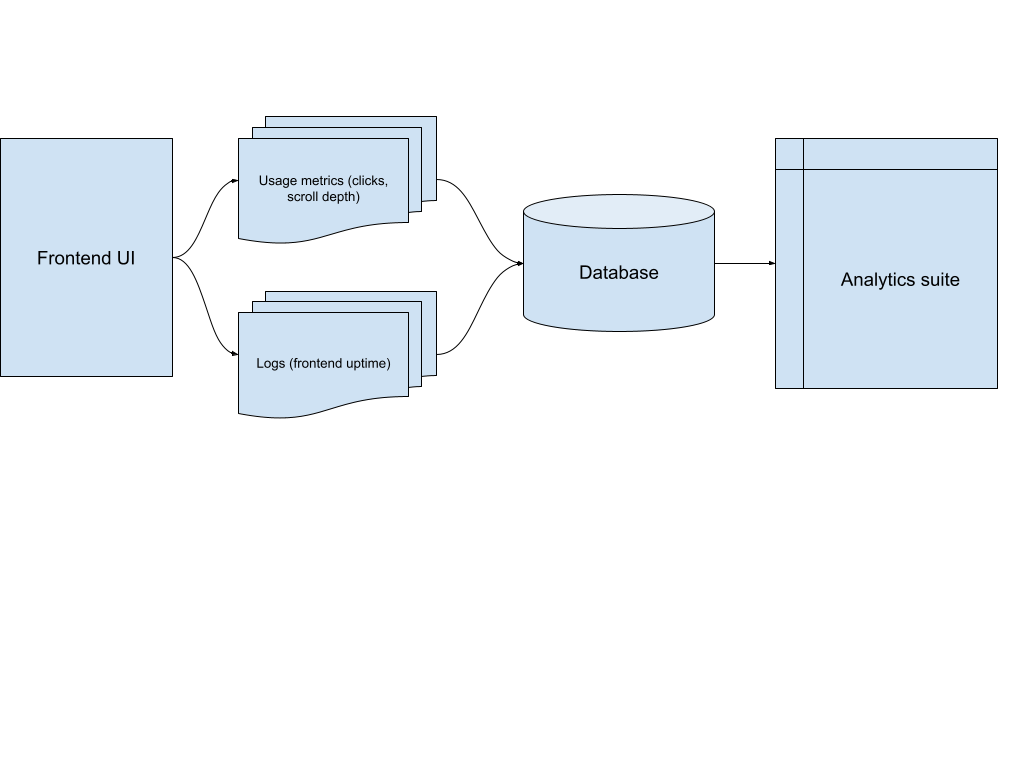
In most cases, architectures of this variety also include a buffer layer such as Apache Kafka®, to sort and otherwise structure the data in a consistent manner. The same usage metrics that drive analytics data, for example, are often used in event driven architectures to trigger specific interactions, and Kafka offers the ability to have multiple services subscribe to these same metrics.
Analyze first, then store
While it may go against the grain, running analysis on your data before storage is a strategy that makes sense for some organizations.
In this architectural path, you do some basic sorting of the data using something like Apache Kafka or similar, and send that data directly to analytics or monitoring software. This strategy is particularly useful for metrics data and observability events, where the goal is to observe a system in near real time to address things like performance issues as they crop up. From there, the data is either destroyed or (more commonly) moved into cold storage if needed for analysis later.
Analyzing before storing suits observability and financial use cases, and other scenarios where you need to view data points in close to a realtime stream rather than a view composed by a dashboard. However, it does introduce the possibility of data loss, presenting data out of order, and increases your vulnerability to outages.
An architecture might look like the following in this use case, for example with OpenSearch®:
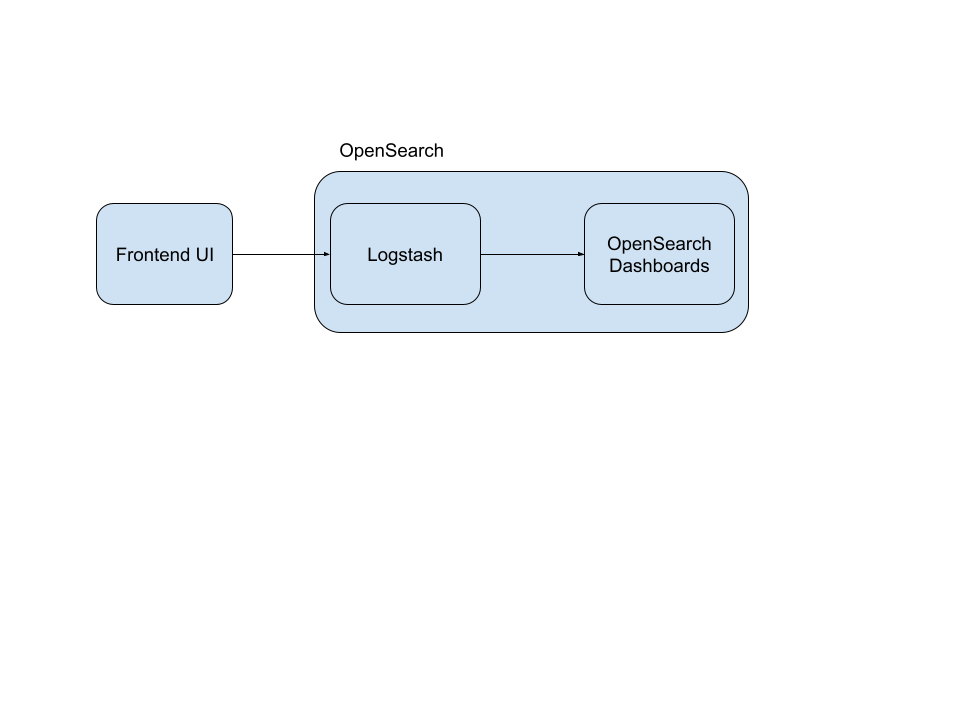
It’s important to note that many analytics suites, such as SuperSet, only function with an intermediary database rather than directly from streaming data, and thus this will not work with more complex systems.
Storing log and metric data
In store-then-analyze use cases, Aiven can act as the reliable landing spot for your data, marshaling it into whatever shape it needs to be in for your analytics and monitoring services. Aiven offers a number of managed data services which can help:
- Aiven for OpenSearch® can help you visualize, analyze and search log data. OpenSearch itself is a data service built specifically to allow you or your users to query large datasets effectively. It’s best paired with Apache Kafka® to sort and stream data into OpenSearch, and a datastore such as AWS S3 or a database like PostgreSQL®. Follow one of our tutorials to use OpenSearch and Apache Kafka for long-term logging , build a data pipeline for AI analysis, or explore a data set using OpenSearch. OpenSearch also provides a data prepper to shape data specifically for use with OpenSearch dashboards.
- Aiven for Apache Kafka®: Apache Kafka is one of the best ways to process and consume data from various services in an organized way. It slots into nearly every data pipeline as a key pub/sub component, and can even stream realtime data in a number of structured data formats like JSON and Apache Avro™. First, learn how to send and receive application data with Apache Kafka and the basics of Apache Kafka producers and consumers, then pair Apache Kafka with Aiven for ClickHouse® and build a realtime analytics pipeline!
- Aiven for ClickHouse® is a columnar database, making it ideal for metrics and analytics use cases, as columnar databases allow you to load in large subsets of data quickly due to their indexing method. ClickHouse is well suited as a backend for business intelligence tools like MetaBase, and integrates well with AI workflows due to its ability to handle large volumes of data.
Aiven monitoring and metrics
Aiven offers two main products specifically geared at monitoring both Aiven services and external services:
- Aiven for Metrics is backed by Thanos, a cloud native, highly available deployment of the Prometheus metrics project. Get started with it today, and easily integrate it with any Aiven service using the Aiven Console!
- Aiven for Grafana®: Grafana® is an easy to use, lightweight dashboard software designed for software teams to monitor infrastructure and usage metrics. Aiven for Grafana specifically integrates quickly with any other services you have deployed on Aiven, such as this example of using it to monitor PostgreSQL metrics.
Monitor Aiven services with Aiven integrations
Aiven also integrates with popular external metrics providers, all managed using the Aiven Console.
- Amazon CloudWatch: Aiven offers dedicated metrics and logs integrations with Amazon CloudWatch for all services deployed to your project. Enabling this is as simple as using the Aiven console. Amazon CloudWatch is most efficient if your services are deployed to AWS already or if you have other infrastructure on AWS, as it offers you a “single pane of glass” monitoring approach in addition to Aiven’s reliability. CloudWatch does lack some sophistication in terms of monitoring and analysis in comparison to dedicated metrics tooling, however.
- Google Cloud logging: similar to Amazon CloudWatch, Google Cloud logging is useful if you’re deeply invested in the Google ecosystem and have other services deployed to Google Cloud. With Google’s history in analytics and BI software, however, they provide a bit of extra tooling and the ability to query data using a SQL syntax. Google Cloud logging is also an excellent choice if you intend to use BigQuery.
- Datadog: Aiven also integrated automatically with Datadog for metrics monitoring via the console. Datadog is an excellent choice if you want to explore observability in addition to metrics or generally want more advanced options when it comes to metrics tooling, Datadog is a category leader for a reason.
Wrapping up
Effectively managing logging and metrics data is crucial for any business, when done correctly it provides a competitive advantage. The choice between storing first and then analyzing, or analyzing first then storing, depends heavily on the specific needs and priorities of the organization. The former approach offers greater reliability and is suitable for most use cases, the latter excels in real-time observability and time-sensitive applications. Aiven provides a robust ecosystem of tools and integrations to support both strategies with the hands-on expertise to help guide you in choosing the right approach.
From Aiven for OpenSearch for log analysis and Aiven for Clickhouse for metrics, to Aiven for Apache Kafka for data streaming and buffering, Aiven empowers businesses to build and manage their data pipelines effectively. Coupled with Aiven’s integrated monitoring solutions, including Aiven for Metrics (backed by Thanos) and Aiven for Grafana, coupled with integrations with leading external providers provide comprehensive observability and control over both Aiven services and external infrastructure all without breaking the bank. Ultimately, Aiven simplifies the complexities of log and metric management, which allows you to focus on deriving value from your data.
Stay updated with Aiven
Subscribe for the latest news and insights on open source, Aiven offerings, and more.